

PID & LID – are two different kinds of Induced Degradation of PV modules. In the first case, Potential Induced Degradation (PID) was conducted by high voltages, and the other is Light Induced Degradation (LID) conducted by sunlight (real or simulated).
The purpose of this article is not to extendedly describe the micro-scale source of these phenomena, but, some real consequences at the MW scale PV plants, considering the basis of a PV project – the simulation by software.
LID – Light Induced Degradation
Silicon PV modules have a natural degradation due to the physical reactions (electrons flow) through the p-n junctions of a PV module. Nevertheless, a concept of (initial) “Power Stabilization” should more widely be used, recognized, and taken into account.
“Power Stabilization” is an initial degradation that occurs when modules are exposed to sunlight. The average percentage of power loss for the first year is usually advertised (in manufacturer’s datasheets) to be around 3%.
“Power Degradation” is nowadays advertised to be around 0,8% for the following years, i.e., after the so-called “Power Stabilization”.
The graphic below summarizes the deviation of Power (Pmpp) of Mono-crystalline and Poly-crystalline PV modules (a total of 58 modules, different brands) relative to the manufacturer’s data. The test was done on new modules, exposed to real sunlight 25 kWh/m^2 (which means 3 days according to the testing site, south of Portugal). After the irradiation exposure, modules were subjected to Maximum Power Determination under STC conditions.
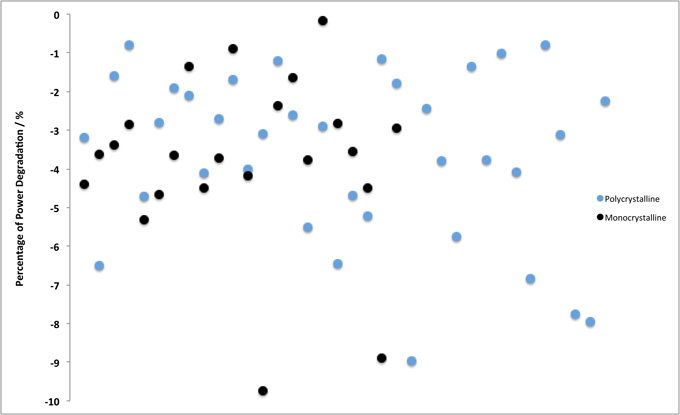
Effects of Light Induced Degradation (LID): Around 57% of the tested modules showed a power loss of more than 3% (as intended to be the power degradation for the first year of operation). Note that these results were obtained after (only) 3 days of sun exposure.
PID – Potential Induced Degradation
PID usually occurs when modules are in strings operating at high voltages (near 1000 V, but not only), combined with very warm and humid weather. Dust and glass degradation (releasing Sodium ions) may catalyze the PID phenomenon.
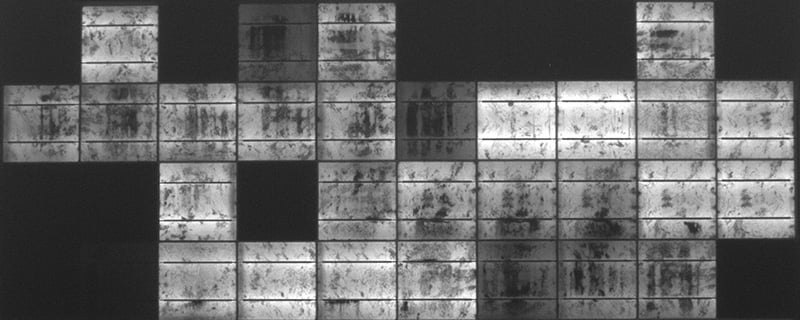
PID-affected modules (often from the negative pole side of a string) usually have a pattern of “black” cells, i.e., cells that were shut down closer to the frame of the module. This pattern has to be with the flow of negative charges, due to the excess of positive charges.
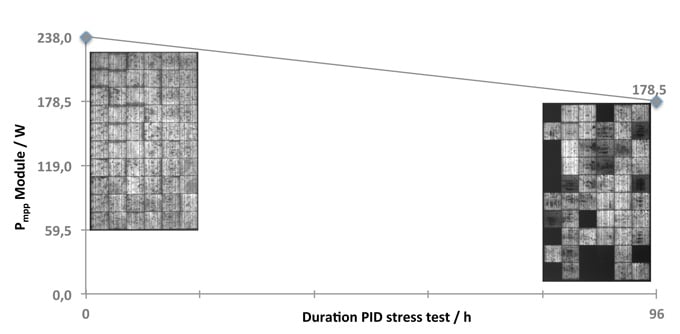
There is an IEC standard (yet in the Draft stage) that aims to test the resistance of PV modules to withstand the PID phenomenon. Basically, one of the methods consist is subjecting PV modules to ±1000 V (DC) inside a climate chamber at 85% rH and 60 ºC, for 96h. The graph shows the Pmpp and Electroluminescence images, before and after the 96-h test.
Solar panel PID stress test graph
The result shown above means a power loss of about 25% after the 96 hours PID stress test. The “Pass” criteria defined by the IEC PID standard states that power loss cannot be above 5% between initial and final measurements. Although this result is relative to 1 module, it’s representative of dozens of PID tests done by the same laboratory on different modules.
Project of a 10 MW PV plant case study – at Ahmedabad
Let’s consider some assumptions to facilitate the approach:
- 10 MW PV plant at Ahmedabad;
- Feed in Tariff (FiT) Rate INR 5,4/ kWh ;
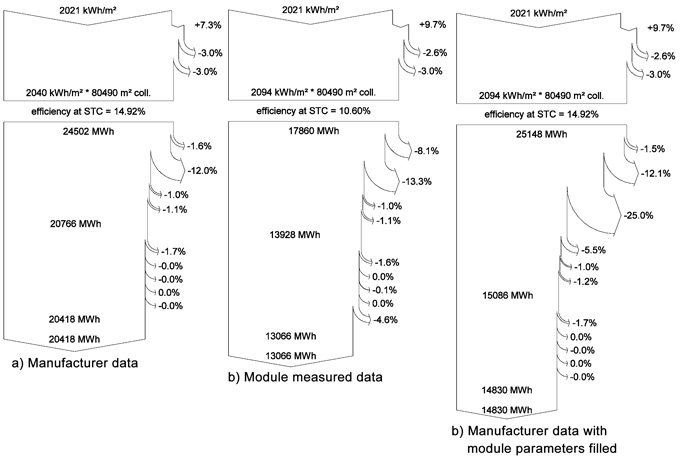
- Energy forecast performed by “software” (avoiding advertisements, it’s a PV project software used globally), using three methods:
- a) modules parameters according to manufacturer data;
- b) modules parameters according to real/measured values in a PV laboratory;
- c) modules parameters acc. to manufacturer data, but filling the options “Module Quality – LID – Mismatch” at the “Detailed losses” software window;
- LID mismatch of 5,5 %;
- PID effect resulting in a deviation of 25 % relative to the initial measurements.
PV plant Losses Diagrams
The three simulations were done using 250 Wp rated modules, with 11 MW of installed capacity, limited to the grid at 10 MW. PID usually doesn’t occur in the first year of operation, although; let’s assume a total mismatch (due to the two phenomena) of 30,5 % – the worst scenario.
A very optimistic result is obtained by making use of the manufacturer’s data. Although, replacing the PV module parameters (at “software” modules database) with the real values measured on a Solar Simulator, the amount of energy injected into the grid is less 36,2 % (comparing with the manufacturer’s data). For the case of simulation, c), making use of a “software” algorithm, and filling the LID and deviation relative to the manufacturer’s data (I used this one for PID effect), the amount of energy injected into the grid is effectively less 30,5 % comparing to the manufacturer’s data simulation.
10 MW PV plant Capital Losses – a case study for the UK, US, India, and South Africa
Picking up the same assumptions and performing a different assessment but more realistic; simulation results will be closer to reality. So, for the next scenario these are the assumptions:
- Two simulations, one based on real/ measured data, and the other, based on manufacturer data;
- For the “real/ measured data” simulation, the assumption is that from the beginning there’s a LID loss of 5,5 % from the beginning, a yearly degradation of 1 %, and PID will affect modules at “Year 3” by 12 % loss of power relative to the previous year;
- For the “manufacturer data”, no LID loss was considered, except a power degradation of 0,7 %/year, and no PID effect;
- Fit or PPA rates assumed are the closest possible as the last auctions in each country.
According to some emerging PV markets, specific locations were selected such as:
- Ahmedabad – India
- Columbia – South Carolina (US)
- Kimberley – South Africa
- Exeter – United Kingdom
Results couldn’t be more expressive.
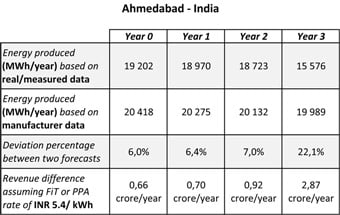 PID and LID effects on PV plant in Ahmedabad | 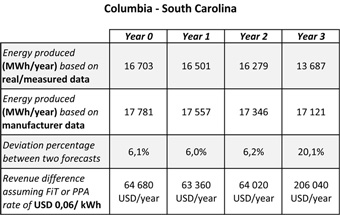 PID LID effects in PV plant in Columbia |
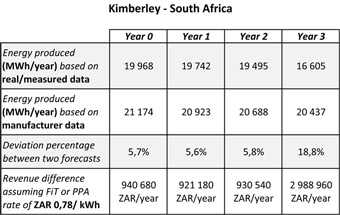 PID LID effects on PV plant in Kimberley South Afric | 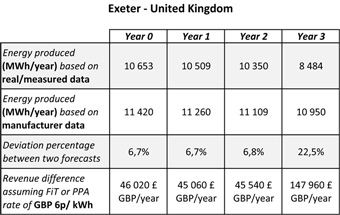 PID LID effects on PV plant in Exeter UK |
Concluding…
One of the main goals of this text is to warn of two “issues” that can have a strong influence on the performance of a PV plant.
Most project developers and investors are aware of Potential Induced Degradation (PID) and Light Induced Degradation (LID) mismatch, but how do quantify their effect on the phase of a PV plant project?
Another goal is to alert for inaccurate energy forecasts. Taking into account that the majority of software has already specific tools where the user can fill with the percentage of deviations relative to the manufacturer’s data, there’s nothing better than considering real/measured values such as Pmpp, Voc, Isc, Impp, Isc, Eff., etc… but also Temperature Coefficients play a crucial role, as well as others.
Last, but not least, and regarding an accurate/ inaccurate PV project, there is a huge difference between considering the Yearly Power degradation, and Yearly Energy degradation. The effective Pmpp difference at the beginning of operation is around 4,8%, which leads to a difference in energy production of around 5,7% and 6,5%. It shall not be considered that Yearly Power degradation has an equal percentage of Yearly Energy degradation.


Evsei Berman
on 10 May 2017Peter D
on 11 Nov 2018