The content of this article is derived from a webinar jointly hosted by Sinovoltaics and Rystad Energy. To access the webinar again, please click on the link provided below:
The article delves into the dynamics of the solar industry, particularly focusing on the import trends, installation levels, and regulatory developments in the US and Europe. It begins by examining the increase in module imports into the US, particularly from South Korea, and highlights the disparity between import levels and installation rates, which can impact prices and market dynamics. The discussion extends to the challenges faced in completing utility-scale PV projects in the US due to permitting delays and interconnection queue issues.
Moving on to regulatory matters, the article explores the impact of the U-F-L-P-A (Unlawful Forced Labor Prevention Act or Uyghur Forced Labor Prevention Act) in the US and its stringent measures to address forced labor issues in supply chains. It details the requirements imposed by the U-F-L-P-A, such as traceability documents and evidence of ethical practices, particularly focusing on solar panels and batteries.
In Europe, the article discusses two complementary regulations aimed at addressing forced labor: the EU Forced Labor Ban and the EU Supply Chain Due Diligence Act. The former takes a top-down approach, identifying products and industries at risk of forced labor and imposing bans on non-compliant products, while the latter employs a bottom-up approach, with companies responsible for identifying and mitigating ESG risks in their supply chains.
Global Supply and Demand:
The solar energy industry is experiencing a notable transformation, driven by several factors such as supply chain transparency, supply chain traceability, technological advancements, and shifts in pricing dynamics. Experts recently examined these solar energy supply chain trends, focusing on the evolution of solar supply chains and their impact on the industry.
One significant area of discussion is the movement towards onshoring solar supply chains, particularly in regions like Europe, India, and the US. Statistical analysis revealed a positive trajectory, indicating increased self-sufficiency within these regions. However, challenges such as permitting delays and grid connectivity issues, particularly in utility-scale PV projects, remain significant hurdles to overcome.
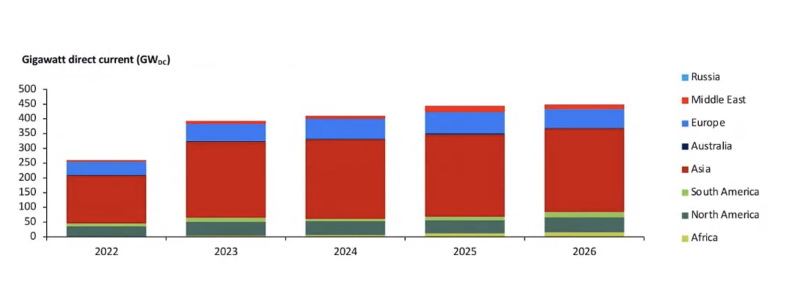 Figure 1 Total annual installed solar PV capacity by continent 2022-2026
 Figure 2 Installed solar PV capacity by system type, 2016-2023
Despite these challenges, there is optimism fueled by decreasing supply chain costs, particularly related to modules and inverters. This trend is encouraging for the economic feasibility of solar projects, especially in residential and commercial sectors.
The demand-supply dynamics of the solar industry are also highlighted, with a focus on the exponential growth of rooftop PV installations. While utility-scale projects still dominate global capacity installations, the growth narrative lies in decentralized solar solutions. Overcoming bottlenecks in permitting and grid integration will be essential to sustaining this growth momentum.
On the supply side, discussions revolved around global manufacturing capacities, with China maintaining a dominant position. However, onshoring initiatives in Europe, the US, and India are reshaping the landscape, albeit at a pace exceeding demand growth. This imbalance has led to downward solar module pricing trends influenced by factors like the polysilicon supply crunch.
 Figure 3 Active & announced global manufacturing capacities 2022-2026
Technology Shift:
Looking ahead, the transition to advanced solar technologies, particularly within the N-type segment, is expected to redefine the industry's trajectory. Despite numerous opportunities, challenges persist, especially for smaller manufacturing players facing margin pressures and project delays.
 Figure 4 Share of cell technology by capacity
The analysis also sheds light on the evolving landscape of solar cell technologies and their impact on pricing dynamics. Topcon technology emerged as a significant highlight, accounting for a majority of cell technology capacity in the previous year. Manufacturers are transitioning from perk to Topcon manufacturing lines driven by market demand and technological advancements, with many perk lines expected to convert to Topcon technology within a relatively short timeframe.
The pricing landscape reflects the ongoing technological shifts within the solar industry, notably seen in the convergence of Topcon prices towards perk prices. This shift is primarily due to the substantial increase in Topcon manufacturing capacities observed in the previous year. Additionally, hetero junction prices have experienced a decline, influenced by lower feedstock prices permeating throughout the solar power value chain.
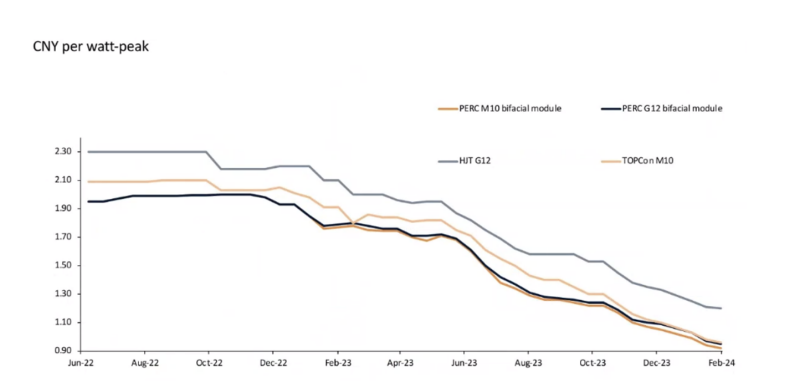 Figure 5 China's module price development
Price Development:
While PV module prices have been on a downward trend since the latter half of 2022, with occasional fluctuations around events like the Lunar New Year, they are expected to stabilize at support levels throughout the year. However, regions with protective policies, such as the United States, may exhibit higher prices compared to regions with free trade agreements with China.
Historically, the United States has maintained slightly elevated prices, influenced by factors such as anti-dumping and countervailing duties (AD/CVD), along with the introduction of the U.S. Foreign Labor Practices Act (UFLPA) in mid-2022. In contrast, regions like Europe have closely followed Chinese price trends, aligning with the global downward trajectory of module prices following the resolution of the polysilicon supply crunch.
 Figure 6 Regional price development M10/G12 PERC modules, 2022-2023
The United States has observed an interesting trend in module prices, initially increasing, followed by a gradual downtrend throughout 2023. This decline is attributed to the alleviation of import bottlenecks in the country. However, prices are not expected to reach the levels observed in other regions due to protective policies in place, necessitating tariffs or additional costs for importing goods.
Onshoring Regions:
The concept of onshoring, particularly prominent in Europe, involves a shift in manufacturing capacities to domestic regions. This is evident in the substantial announced capacity for module manufacturing in Europe. However, the situation regarding earlier value chain segments such as polysilicon and wafer production is less optimistic, with minimal activity observed, especially in Europe and the US.
European manufacturers are grappling with challenges, leading to the closure or relocation of some operations to the US to benefit from better incentives for manufacturing. Despite the announced capacities in Europe, there remains a risk associated with their actual implementation, especially considering the profitability of ventures.
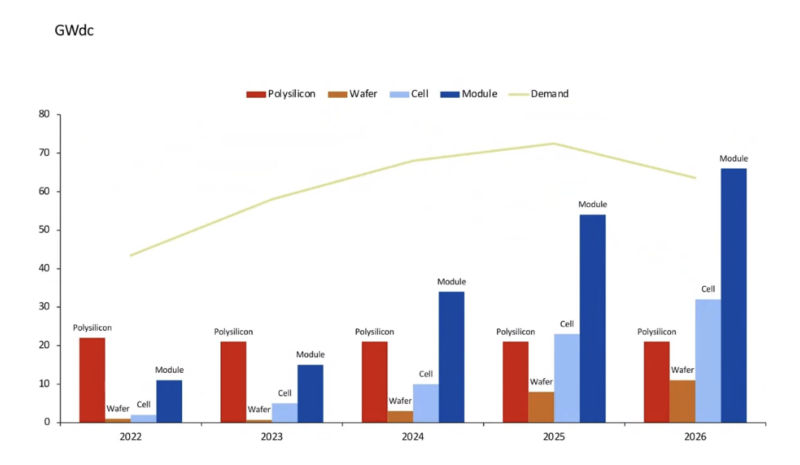 Figure 7 Active and announced manufacturing capacities in Europe, 2022-2026
Moreover, the disparity between different value chain segments persists, necessitating imports to cover gaps in production capacity. This applies across various segments, from cell to module production. Additionally, the demand for polysilicon from European manufacturers has diminished, leading to surplus production redirected to China.
The trend of increasing imports of modules into Europe, which began in 2022, is linked to developments in the US market, particularly the implementation of the UFLPA. Europe has emerged as a significant market for Chinese manufacturers, compensating for their reduced access to the US market.
Overall, the dynamics of onshoring and import trends underscore the evolving landscape of solar supply chains, with implications for pricing, manufacturing, and market dynamics in regions across the globe.
By the end of 2022, the disparity between imports and installation levels in Europe had widened significantly, reaching approximately 6.7 gigawatts DC. Although there was some growth in imports in 2023 compared to 2022, the rate of increase had slowed down. Nonetheless, the gap between installations and imports in 2023 was narrower than in 2022. Importantly, the time required to clear excess imports or inventory was decreasing, indicating a positive trend.
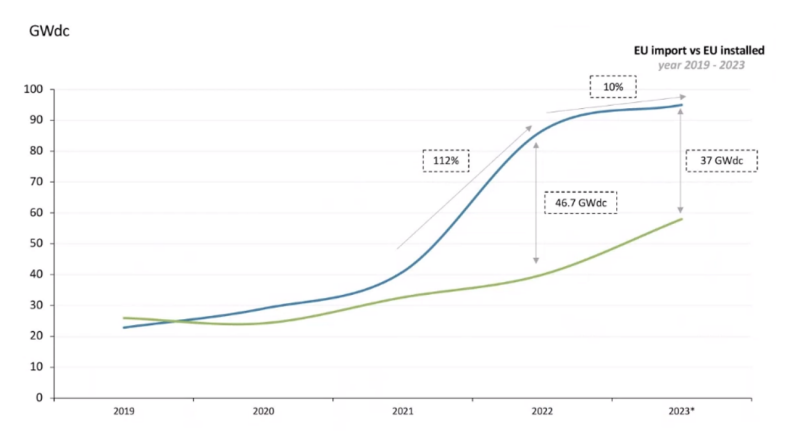 Figure 8 Solar module imports from China VS PV installation in Europe
The uptick in imports, even surpassing installation levels, is not necessarily negative. It has provided a buffer against PV prices in Europe, ensuring an adequate supply of modules. However, the cost breakdown of European-manufactured solar PV modules reveals a significant disparity between production costs and current market prices. With European-made panels costing around 25 US dollars cents per watt produced, manufacturers face challenges competing with imported modules priced at approximately 12 US dollars cents per watt.
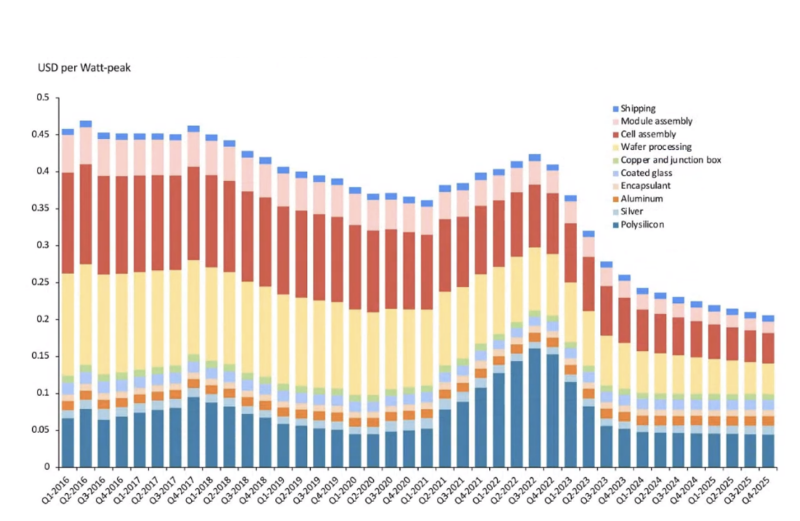 Figure 9: Cost of European-manufactured solar PV PERC module
Although efforts may be made to introduce incentives supporting European manufacturing and enhancing competitiveness against imports, progress in this regard has lagged behind regions like the US and India. To bridge the gap between import levels and installation levels, steps must be taken to address installation bottlenecks. For instance, reducing permitting times for utility-scale solar projects, currently prolonged in various European countries, could stimulate installation growth.
Moreover, the issue of PV price cannibalization poses a challenge to the economics of solar PV projects, especially in regions with high PV penetration into the energy mix. Integrating battery storage systems into PV projects could alleviate this issue by enabling excess energy storage for use during peak hours or sale back to the grid.
Furthermore, while Europe remains a major destination for imports, the Netherlands, particularly the port of Rotterdam, serves as a key entry point for imported modules. The trend of coupling battery storage with PV projects is more pronounced in regions like the US and Asia, with Europe expected to follow suit in the future.
 Figure 10 EU finally tackles excessive permitting times
In summary, addressing permitting challenges, integrating battery storage, and incentivizing domestic manufacturing are crucial steps to narrow the gap between imports and installations in Europe's solar PV market.
The substantial increase in solar module imports by the United States in 2023 is notable, particularly given the supply chain bottlenecks experienced in 2022 due to factors such as the A-D-C-V-D and the U-F-L-P-A. These bottlenecks led to price surges and limited module access in the US market. However, the fact that the US emerged as the second-largest importer of solar modules in 2023 suggests that these bottlenecks have been mitigated.
India and Turkey also emerge as significant importers of solar cells, mirroring a trend similar to the US in terms of their manufacturing landscape. Like the US, these countries possess substantial module assembly capacity but lack adequate cell assembly capacity to meet demand. This trend indicates a shift from importing modules to importing earlier value chain components like cells, wafers, and polysilicon.
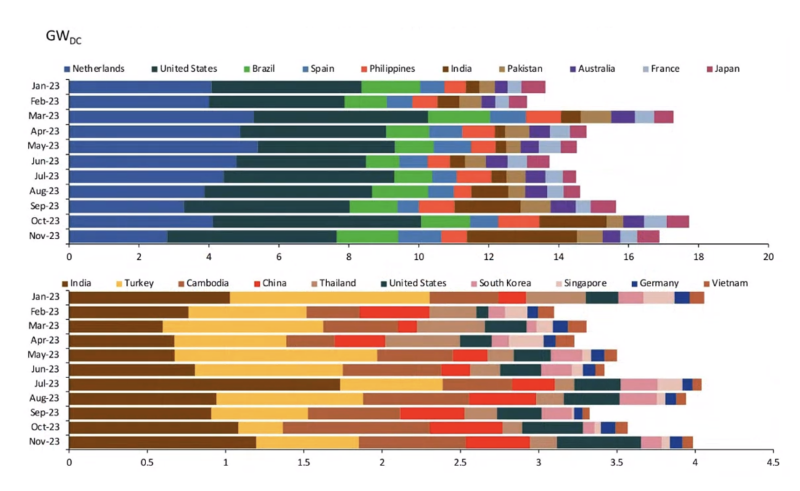 Figure 11 Top destinations for traded solar modules (top) and cells (bottom)
India, in particular, has witnessed a surge in module assembly capacity, coupled with a reliance on imports for cells and wafers, signaling a move towards downstream manufacturing activities with a need for a steady supply of raw materials. Similarly, Europe and the US are observing similar trends, with announcements of increased cell manufacturing capacities alongside module assembly capacities.
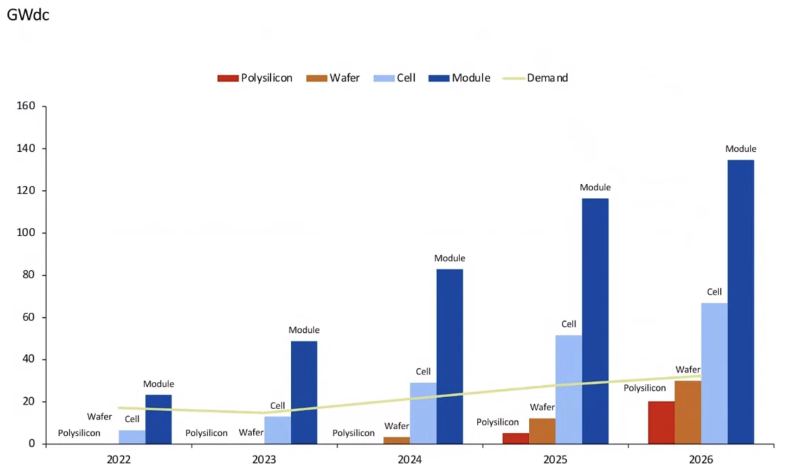 Figure 12 Active and announced manufacturing capacities in India
However, concerning polysilicon, the reopening of the REC Moses Lake plants in the US represents previously dormant capacity coming back online. Despite incentives like operational expenditure incentives, the excessive costs associated with polysilicon production may deter companies from entering this sector.
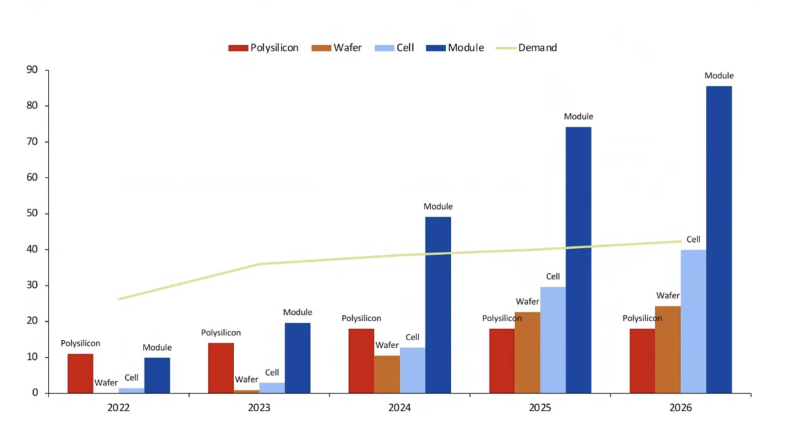 Figure 13 Active and announced manufacturing capacities in the US
Regarding the US market, the rise in both module and cell imports reflects a shift in supply chain dynamics. Although none of these imports originate directly from China, the surge in imports, particularly from South Korea, indicates an increasing reliance on imported components to satisfy domestic demand.
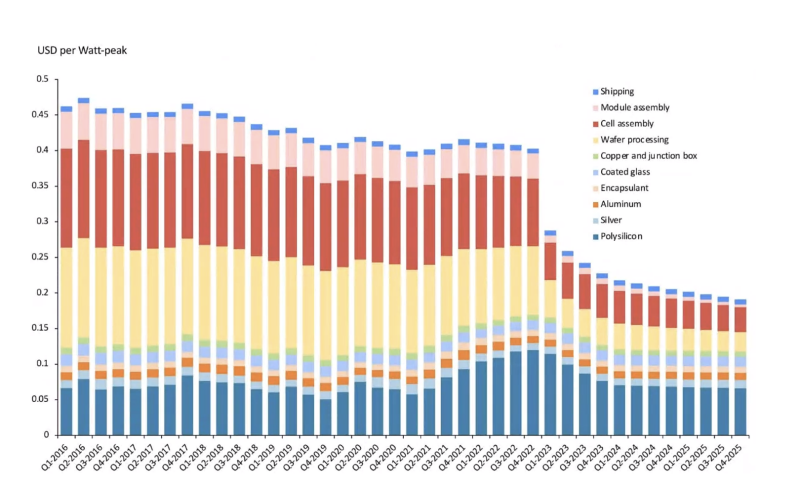 Figure 14 Cost of US-manufactured solar PV PERC module.
The disparity between import levels and installation levels in the US highlights challenges in project implementation, primarily due to extended permitting times and interconnection queues for utility-scale solar projects. Despite substantial planned capacity, delays in project completion have resulted in a backlog of projects awaiting grid connection.
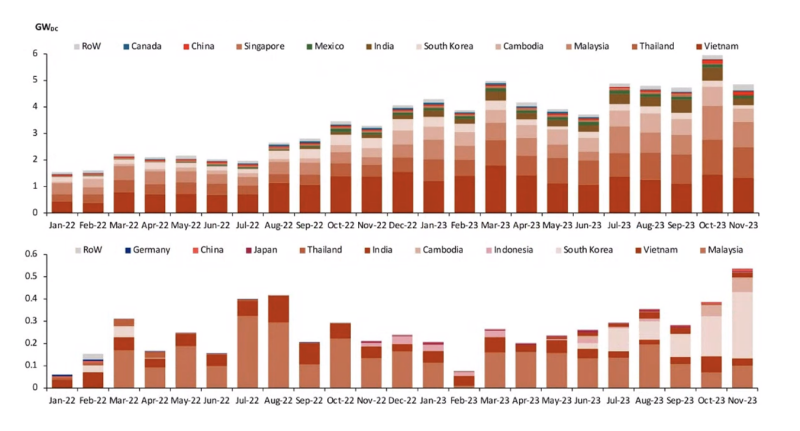 Figure 15 US imported solar PV volumes for modules (top) and cells (bottom) by country of origin
Efforts are underway to tackle these challenges, including the implementation of measures like deposits and withdrawal fees for entering the interconnection queue. However, the process of bringing utility-scale PV projects online in the US remains intricate and time-consuming.
In summary, the trends observed in solar PV imports underscore the evolving dynamics of the global supply chain, with countries like the US, India, and Turkey experiencing shifts in their manufacturing landscapes and import dependencies. Addressing challenges in project implementation and ensuring a consistent supply of raw materials will be essential for the continued growth of the solar PV industry in these regions.
The import of solar modules into the US witnessed a significant increase in 2023, despite not originating directly from China. While import levels remained stagnant in 2022, they surged in 2023. Conversely, cell imports into the US had been relatively unpredictable until the end of 2023 when an uptick was observed. Much of this increase in module imports can be attributed to South Korea, likely tied to companies like Q Cells and their module assembly operations.
However, this surge in imports does not fully address the disparities in the US value chain. While import levels surged, installation levels did not keep pace, leading to a backlog of projects awaiting connection to the grid. For utility-scale PV projects in the US, there was a significant gap between planned and completed installations by the end of 2023, largely due to permitting times and the interconnection queue.
 Figure 16 Solar module imports vs PV installation US
The interconnection queue in the US has been growing rapidly, reaching 1.1 terawatts by recent accounts. This backlog is exacerbated by projects being entered into the queue simply to secure a place, regardless of whether they are viable or will ever come online. To address this, measures are being implemented, including deposits for entering the queue and withdrawal fees, aimed at reducing the number of speculative projects and clearing the backlog.
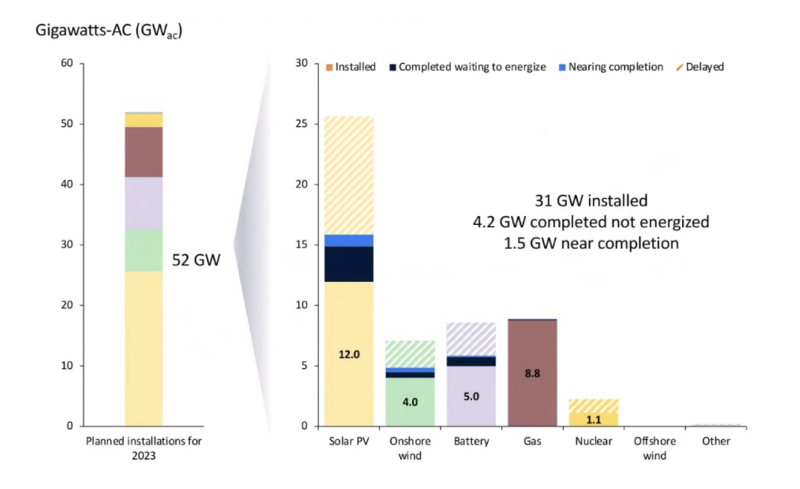 Figure 17 2023 planned capacity vs end-of-year installations
Despite the challenges posed by policies like the U-F-L-P-A, manufacturers and suppliers have shown adaptability. While initially causing disruptions, companies have been able to adjust to policy changes within months. This adaptability has been evident even with the impending end of the A-D-C-V-D moratorium in June, with companies already taking action to establish manufacturing plants outside of China to avoid tariff duties.
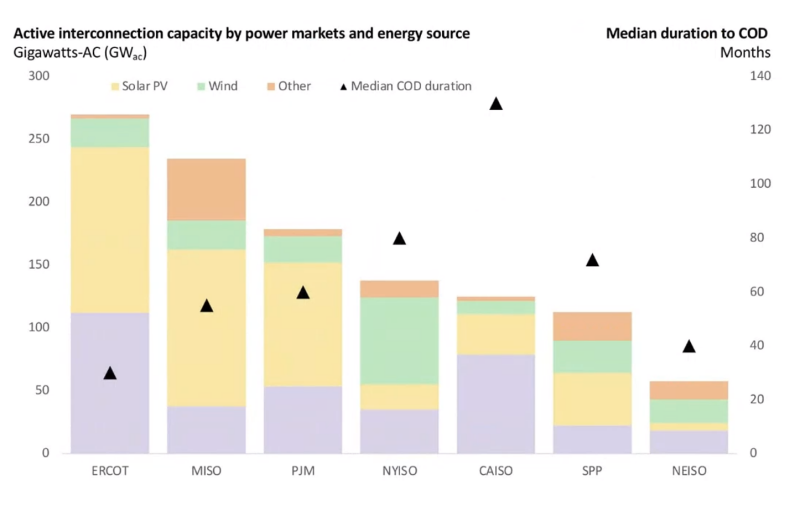 Figure 18 Active interconnection capacity by power markets and energy source
The traceability issue in the solar industry gained significant attention following the release of the Inroad Daylight reports in 2021, which highlighted concerns about forced labor in Xinjiang, China. These reports prompted action in both the US and Europe to address traceability concerns within the supply chain.
 Figure 19 UFLPA statistics, Electronics and Industrial and Manufacturing Materials
Subsequent reports, such as Overexposed and those from NGOs like Anti-Slavery, further underscored the need for transparency in the solar supply chain. Manufacturers have been pressured to take steps to ensure greater visibility and accountability in their sourcing practices.
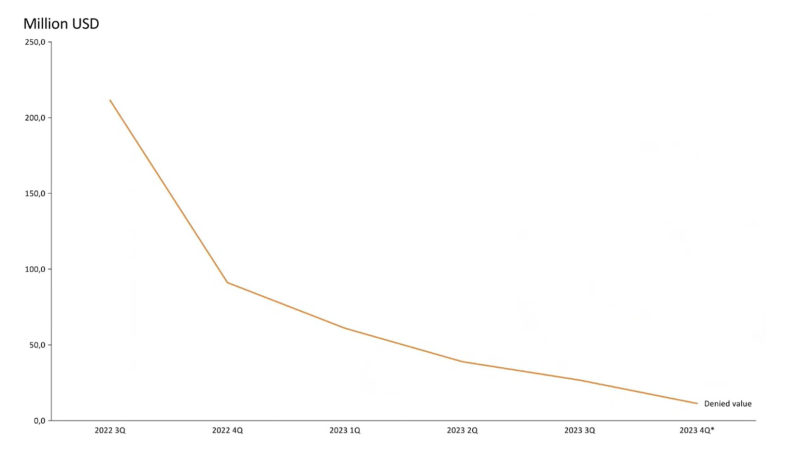 Figure 20 UFLPA statistics, Electronics and Industrial and Manufacturing Materials denied shipments
In response to mounting concerns about forced labor in the solar industry supply chain, the US enacted the False Skateboard Prevention Act (U-F-L-P-A) as a pivotal regulation for traceability. This policy was swiftly enforced, leading to the detention of shipments shortly after their introduction. Regarded as one of the strictest regulations globally, the U-F-L-P-A underscores the urgency of addressing traceability issues in the solar sector.
Despite initial disruptions, manufacturers have adapted to the U-F-L-P-A and similar regulations, emphasizing the industry's commitment to transparency and accountability. The U-F-L-P-A has significantly impacted the solar industry, particularly in the detention of solar panel shipments. In August 2022, demand for solar panels surged, resulting in a notable increase in detained shipments. Around 20% of shipments in 2022 were detained, equivalent to approximately two gigawatts of solar panels. Interestingly, despite the prevailing notion of Chinese dominance in solar panel manufacturing, Chinese-made panels constituted a small fraction of those detained.
The US Customs and Border Protection (CBP) platform provides crucial data for evaluating the U-F-L-P-A's impact. Since its inception in June 2022, the CBP has detained modules worth $2 billion, underscoring the scale of enforcement.
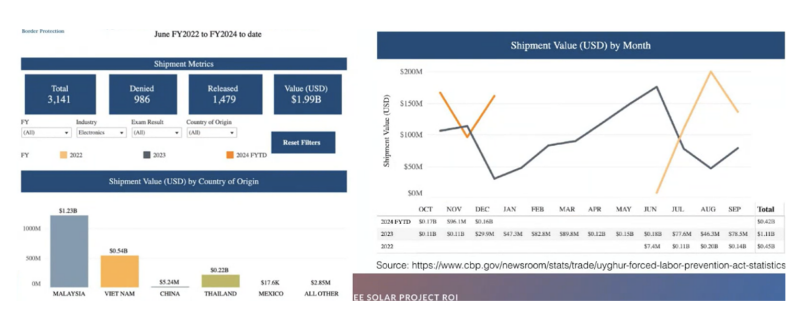 Figure 21 US shipments metrics from FY2022 to FY2024
UFLPA:
The U-F-L-P-A mandates traceability documents throughout the solar panel supply chain, from modules to polysilicon. Manufacturers must furnish manufacturing proofs, production contracts, and transportation data, including bills of lading and customs declarations, to ensure shipment legitimacy.
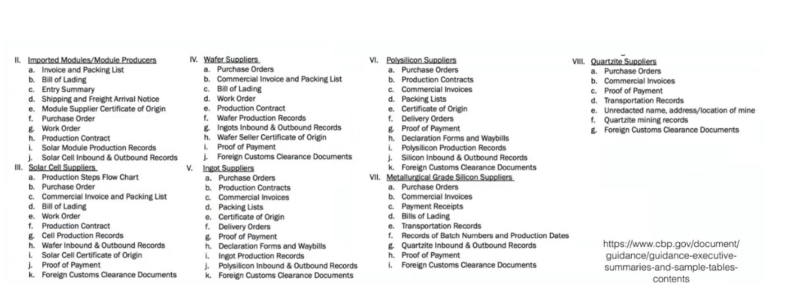 Figure 22 USA: UFLPA Requirements for Modules
Furthermore, the U-F-L-P-A expanded its scope to include batteries since November 2022. Battery traceability requirements encompass battery design, components, manufacturing processes, and equipment used. While no energy storage shipments have been detained yet, this could change abruptly.
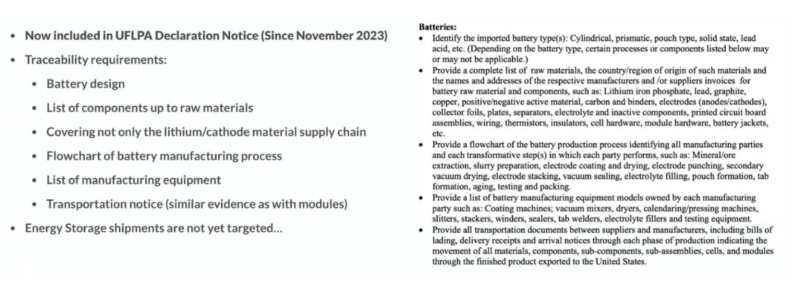 Figure 23 USA: UFLPA Requirements for batteries
Europe has also taken strides to address traceability concerns in the solar industry, albeit at a slower pace than the US. Similar regulations in Europe underscore the global drive for supply chain transparency and accountability.
Efforts in Europe to combat forced labor in supply chains are advancing through two complementary regulations: the EU Forced Labor Ban and the EU Supply Chain Due Diligence Act. The EU Forced Labor Ban adopts a top-down approach, with a central bureau assessing products and industries vulnerable to forced labor. Importers of such products must demonstrate efforts to evade forced labor, with non-compliant products facing bans from the EU market. The expected adoption of this regulation is late 2024, with implementation within 18 months to two years.
 Figure 24 EU Response – Regulations
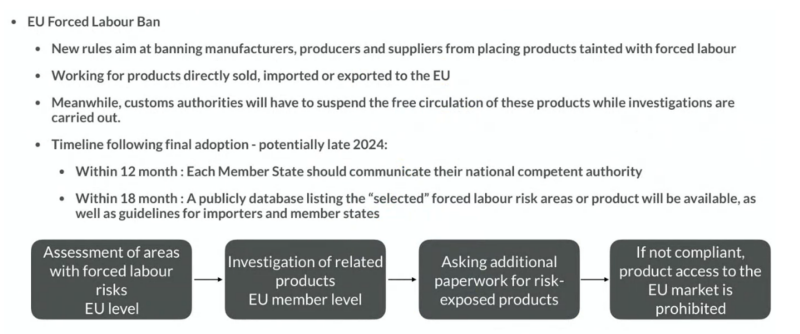 Figure 25 EU Forced Labour Ban
Conversely, the EU Supply Chain Due Diligence Act employs a bottom-up approach, with individual companies defining and addressing ESG risks in their supply chains, including forced labor. Companies must annually report their risk mitigation efforts, with additional EU inquiries, as necessary. National regulations, like those in Germany, align with this EU-level approach, anticipating implementation by 2027.
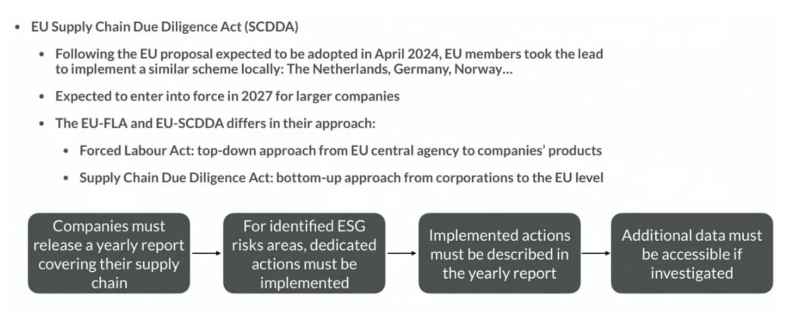 Figure 26 EU Supply Chain Due Diligence Act (SCDDA)
While the US primarily targets forced labor issues related to Xinjiang through regulations like the U-F-L-P-A, the EU's approach is broader, encompassing forced labor and ESG risks globally. However, the EU's comprehensive process moves slower due to its broader scope. Ultimately, both regions aim to ensure transparency and ethical practices in the supply chain for PV components.
Conclusion:
The solar supply chain ecosystem is undergoing a transformative phase, marked by a quest for transparency, resilience, and sustainability. Navigating this landscape will require concerted efforts from industry stakeholders to address challenges and capitalize on emerging opportunities, thereby accelerating the global transition to clean energy.
The article emphasizes the contrasting approaches taken by the US and the EU in addressing forced labor and components of PV supply chain transparency in the solar industry. While the US has acted swiftly with regulations like the U-F-L-P-A, focusing primarily on Xinjiang-related issues, the EU's approach is more comprehensive, aiming to address forced labor and ESG risks globally. However, the EU's process is slower due to its broader scope and may take time to implement fully. Nonetheless, both regions are working towards ensuring ethical practices and transparency in solar supply chains to promote sustainability and social responsibility.

