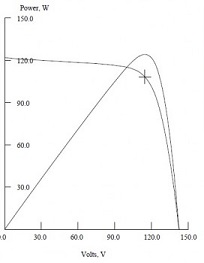
Current-Voltage/ I-V Curve: explanation and use

The current-voltage (I-V) curve is generated during the flash test of a solar panel and depicts in a chart the relationship between electrical current intensity (I) and voltage (V).  

What are the technical parameters depicted in the I-V Curve?

Current intensity, expressed in amps, and voltage (V), expressed in volts, are the y-axis and x-axis in a graph depicting their relationship in bipolar electrical devices. In photovoltaics, the maximum current of a solar PV module is equivalent to resistance R (= V/I) of zero ohms in the circuit and is commonly referred to as the short circuit current(Isc). At this maximum point, the voltage V in the circuit is zero. Connecting the resistance, the voltage increases while the current intensity slightly decreases. Further increases of the resistance lead little increase in voltage but a current intensity of near zero. At maximum voltage, there is a break in the circuit, known as open circuit voltage (Voc). The I-V curve depicts these two extremes in a graph with Isc shown in the y-axis and Voc the x-axis.

Current-Voltage curve


How to read the Current-voltage (I-V) curve?

Drawing the curve, there is only one point where at which maximum power (Pm), expressed in watts, of the solar PV module is delivered. This break point is know as maximum power point (MPP). The I-V data of a solar PV device cab be measured using various testing standards. The most commonly of these is standard testing conditions (STC) which is also the underlying standard of above sample I-V curve from a tested solar panel. STC specifies a clear sunny day with irradiance of 1,000 watts per square meter (1,000 W/ m²) and no shading.

Place comment