This article is about Temperature Coefficients and their influence on the performance of a 10 MW PV plant(simulated).
Temperature Coefficients are usually described with words coming from the Greek alphabet: α, β, and γ, intended to represent the electrical behavior of a PV module in the function of Cells temperature and in terms of Current (α), Voltage (β) and Power (γ).
A number of tests were performed at an Accredited Photovoltaic Laboratory which results will be shown below, but before that, let’s look at the contents of this post:
- PV modules overall condition (Electroluminescence and MaxPower STC)
- Temperature Coefficients determination
- PVSyst simulation for a 10 MW plant, based on:
- All Nameplate data;
- All Measured data;
- Only Temperature Coefficients Measured W/ rest of Nameplate data:
- Financial Assessment
Overall Condition
4 different PV modules were randomly picked from a certain amount and identified in alphabetical order according to their power output. These modules are in an almost new condition (and were subjected to a power stabilization of around 25 kWh/m2).
Electroluminescence images are as shown below:
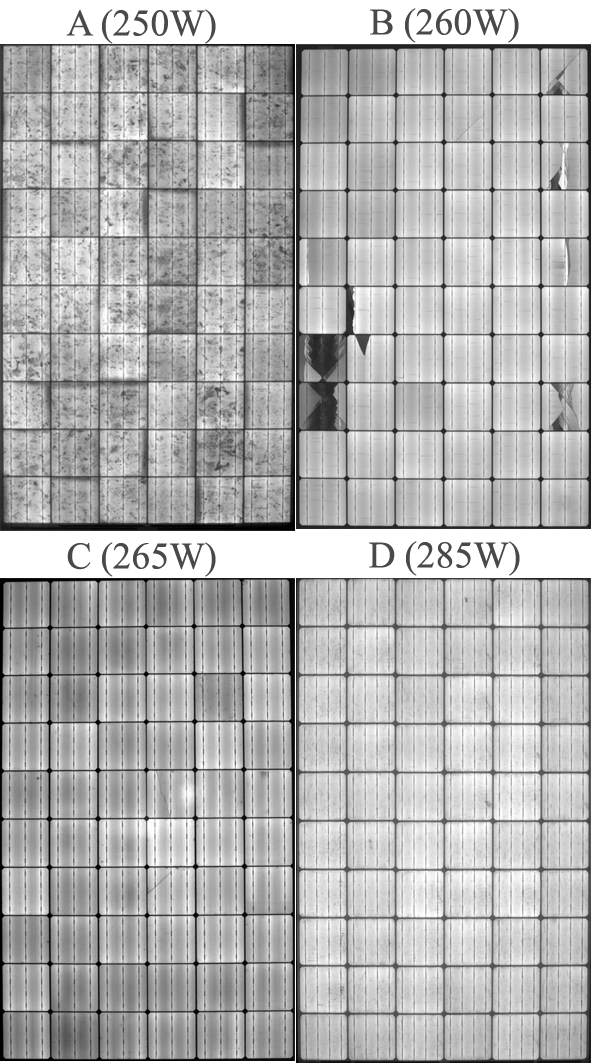 EL comparison
It’s important to refer that microcracks (and others not so “micro”) were already at the time they were delivered to the Lab, i.e., no forced cracked cells.
As expected, some of these solar modules showed great mismatches between measured values and nameplate data for Pmpp.
 Pmpp mismatch
Surprisingly, the module showing the most severe cell-inherent defects is not the one with the major mismatch. An (almost) apparently “clean” module, such as “C” shows an enormous difference at Pmpp. This is a typical case of a strong “off-spec” module with low-efficient cells.
Temperature Coefficients Determination
This normalized test was conducted according to 10.4 of the standard IEC 612515:2005. First of all, there are mismatches (which is not surprising!), but the fact is that some of those differences are in a different order of magnitude!
 Temperature Coefficients mismatch
To assess the testing equipment stability and measuring reproducibility, the tests were repeated multiple times, although, those (enormous) differences remained.
PVSyst simulations for a 10 MW plant
Running three types of simulations to assess differences between them, some electrical parameters were changed in the PVSyst module database.
(1) simulation based on default manufacturer data;
(2) simulation based on real measured data;
(3) based on default manufacturer data changing only the T.Coeffs for real measured values.
Some assumptions to keep in mind:
(a) simulation site: Moura (Portugal) with a yearly GHI of around 1754 kWh/m2 and a yearly average temperature of 16.3 ºC;
(b) ideal tilt (33º) and azimuth south;
(c) 20 x 500 kW central TL inverters and a layout of 2590 strings with 17 PV modules in series;
(d) a PPA rate of 0.08 €/kwh.
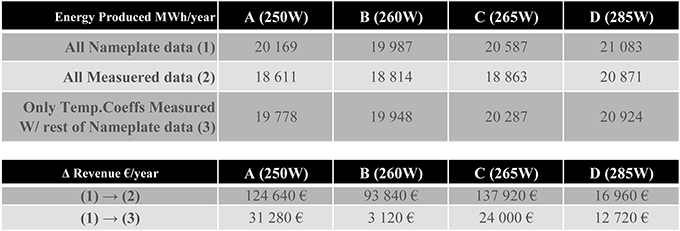 Simulation for a 10 MW PV plant
Although not showing the absolute total revenue amount, it is intended to show the difference between measured and manufacturer values, showing two scenarios: only taking into account measured Temperature Coefficients and STC Maximum Power as well.
Financial Assessment
The purpose of this assessment is not to publish a cash-flow analysis nor to display a complete and complex financial model.
Instead of that, it’s aimed at considering the “Fixed Operating Costs” and identifying the weight of the PV module’s data mismatch into the total revenue of a (simulated) 10 MW PV plant:
 Global Operation Costs
If you only consider measuring the real Temperature Coefficients (with no other electrical parameters measures) and picking up the worst-case scenario – module “A” – the revenue loss is around 26% of the O&M yearly cost.
Considering module “C” (the most “off-spec” in terms of Pmpp) that according to Electroluminescence is in a very good condition, the revenue loss surpasses the O&M costs and lies on 69% of the fixed operating costs. This approach is valid when you take into account all real measured parameters.
Conclusion
Being in straight contact with many O&M professionals and PV plant owners, many of them wonder why their PV plants are performing below their projections.
Temperature Coefficients are crucial parameters (as well as others) for an accurate PV design, and even more when observing a strong development of PV plants in very warm regions.
Always keep in mind that Quality Assurance tests are not an expense, they’re part of an overall sound investment.




Anonymous
on 23 May 2016Anonymous
on 15 Jun 2016